Space to Grow
Experience the future of workspace in San Juan's most prestigious location. Modern amenities meet ocean views in a setting designed for success.
Explore Spaces
Experience the future of workspace in San Juan's most prestigious location. Modern amenities meet ocean views in a setting designed for success.
Explore SpacesDesign your perfect office with customizable spaces and executive services.
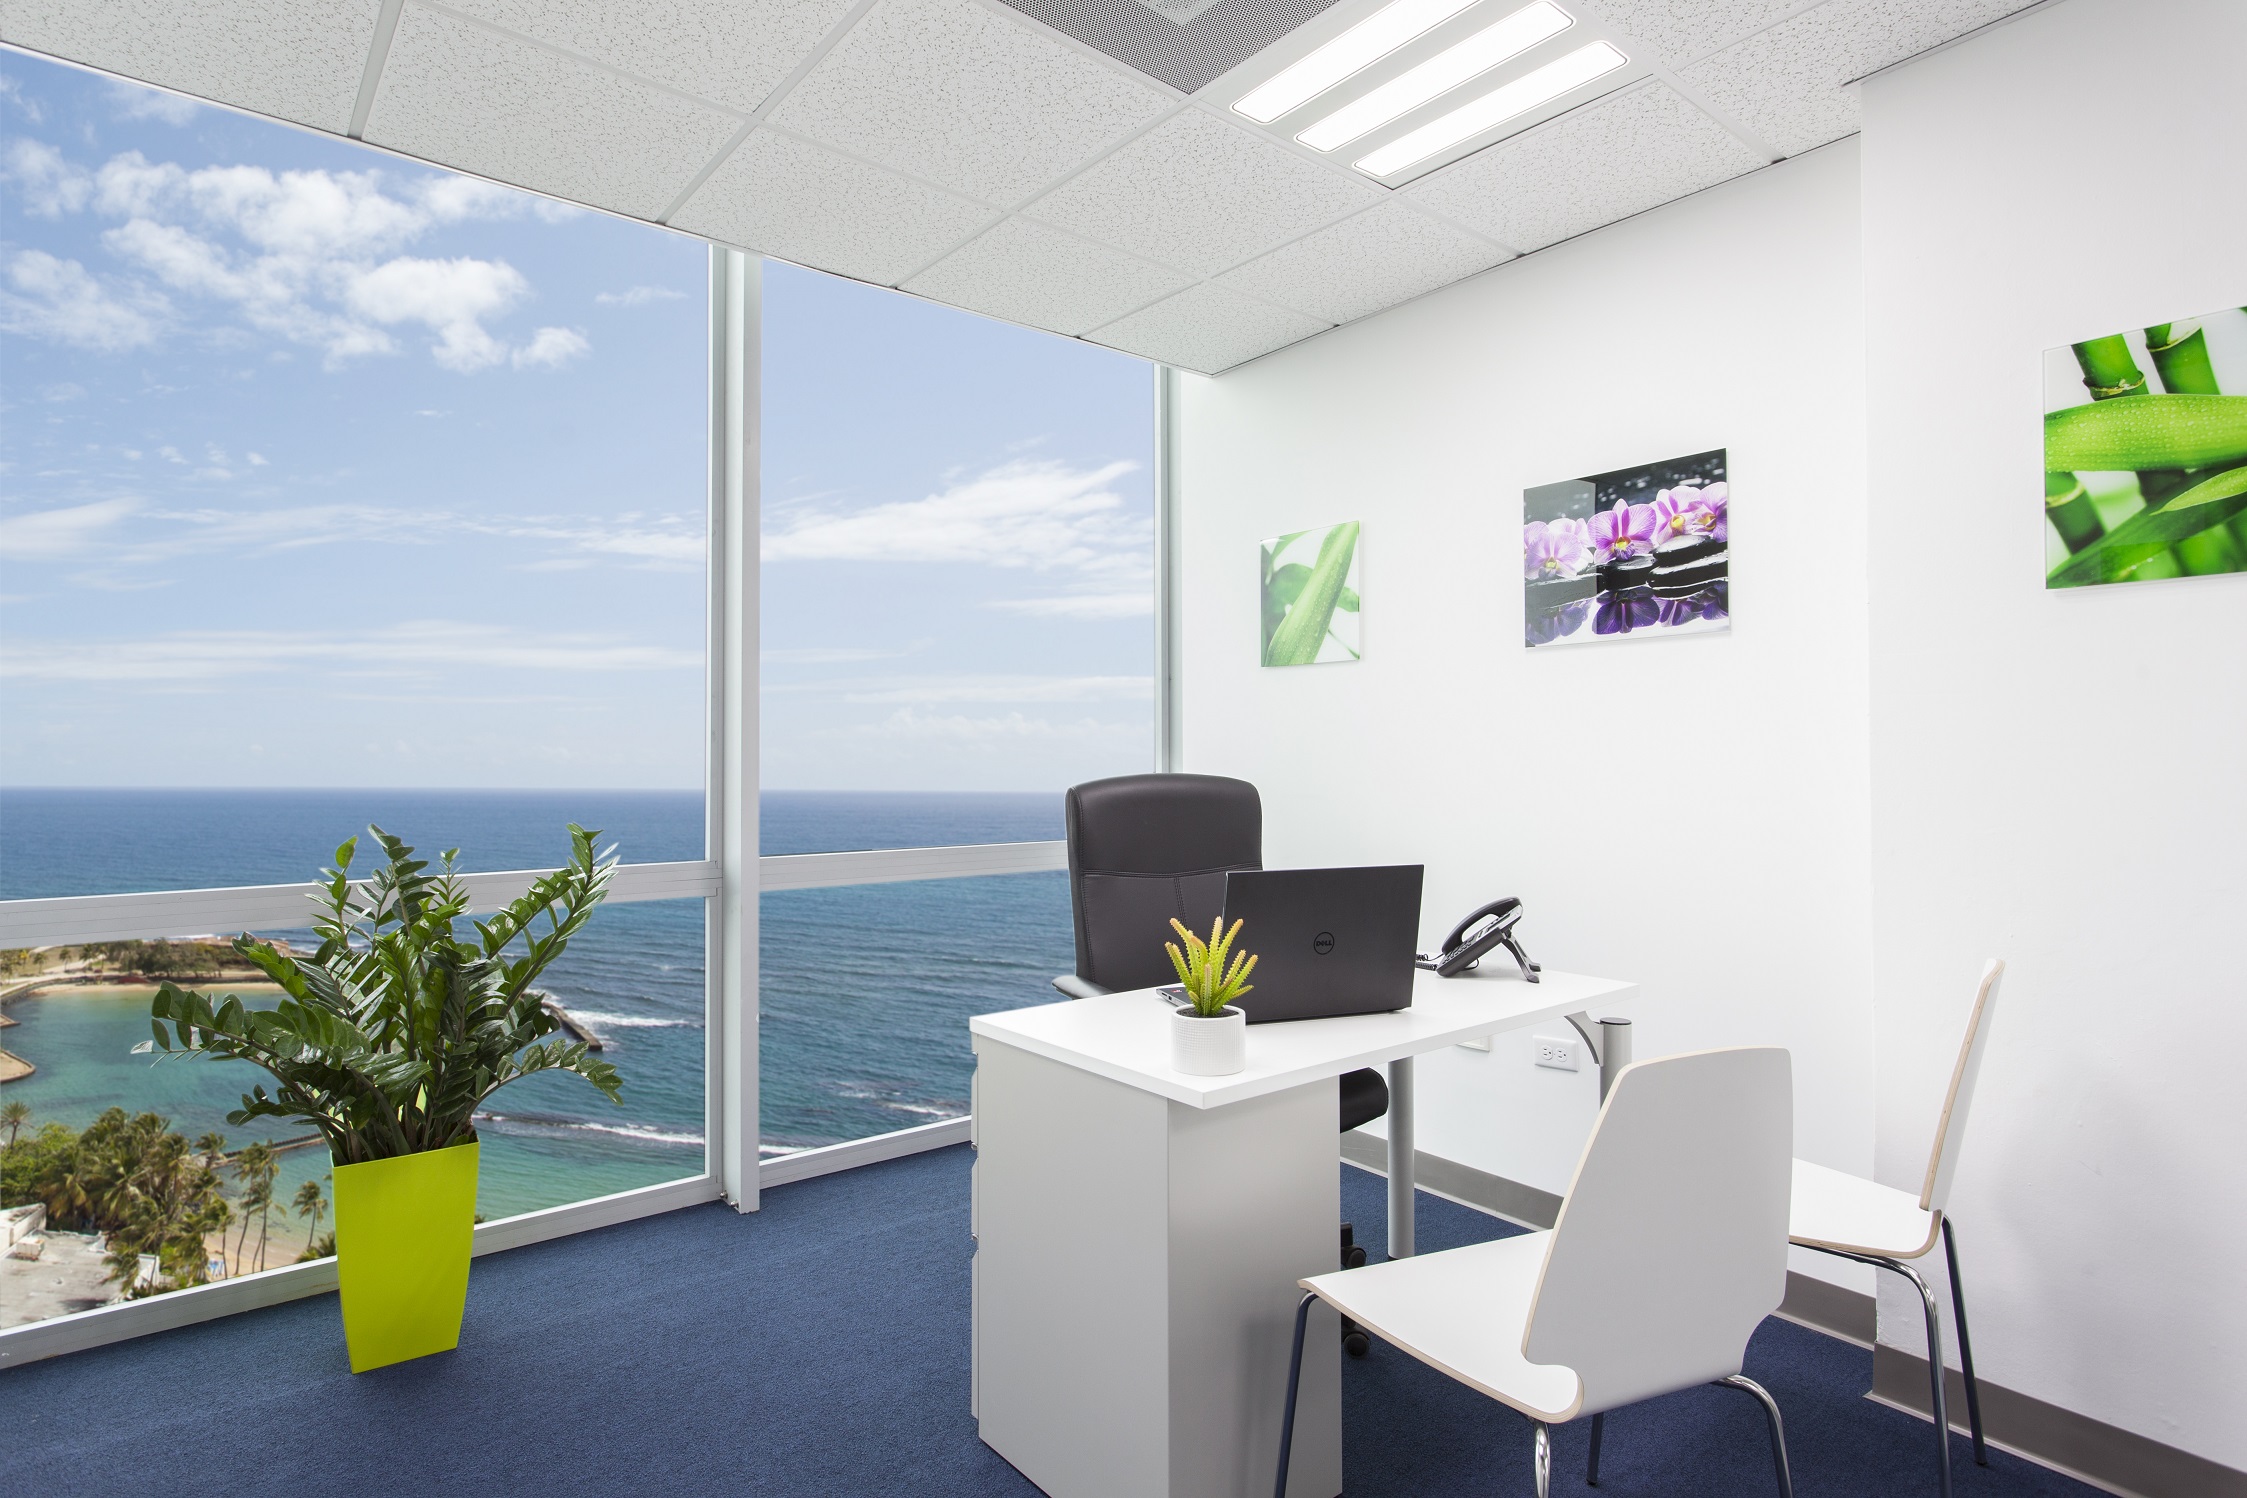
You will feel like you're working from paradise, just steps away from the beach.
Enjoy island life, without sacrificing speed. We offer the best in internet and technology.
Stay connected, even when you step out of the office, with the help of our attentive personnel.
Long Term, Short Term Private Offices, Virtual Office Space and Co-Working Stations in an Open Floor Plan.
We are strategically located at the intersection between business and pleasure.


Monday through Friday from 8:00am to 5:00pm a live receptionist will be answering all incoming calls on behalf of your company. This will give you the professional image you require to get ahead of the competition.
Use our address to receive all your mail and packages.
Select one of our local phone numbers as your primary company line.
All faxes received will be forwarded to your provided E-Mail address in a PDF format.
All voice mail messages received will be forwarded to your provided E-Mail address as a WAV Audio file.
All calls that are being transferred to your personal extension by our Live Receptionist will ring up to 4 phone numbers provided by you. If the call is not answered your personal extension voice mail box will activate.
Forward your calls to a number of your choosing.
We can receive, store, or forward your documents and packages at your convenience. Domestic and International shipping options are available.
Our concierge service, available from 8 AM – 5 PM will assist you with restaurant reservations and recommendations, hotel bookings, airport transportation and anything else possible to make your visits to San Juan as seamless as possible.
We have a network of restaurants, hotels, transportation providers, tour operators and others that give Oficina members preferred pricing and last minute reservations. We'll make sure you're in the preferred crowd in San Juan.
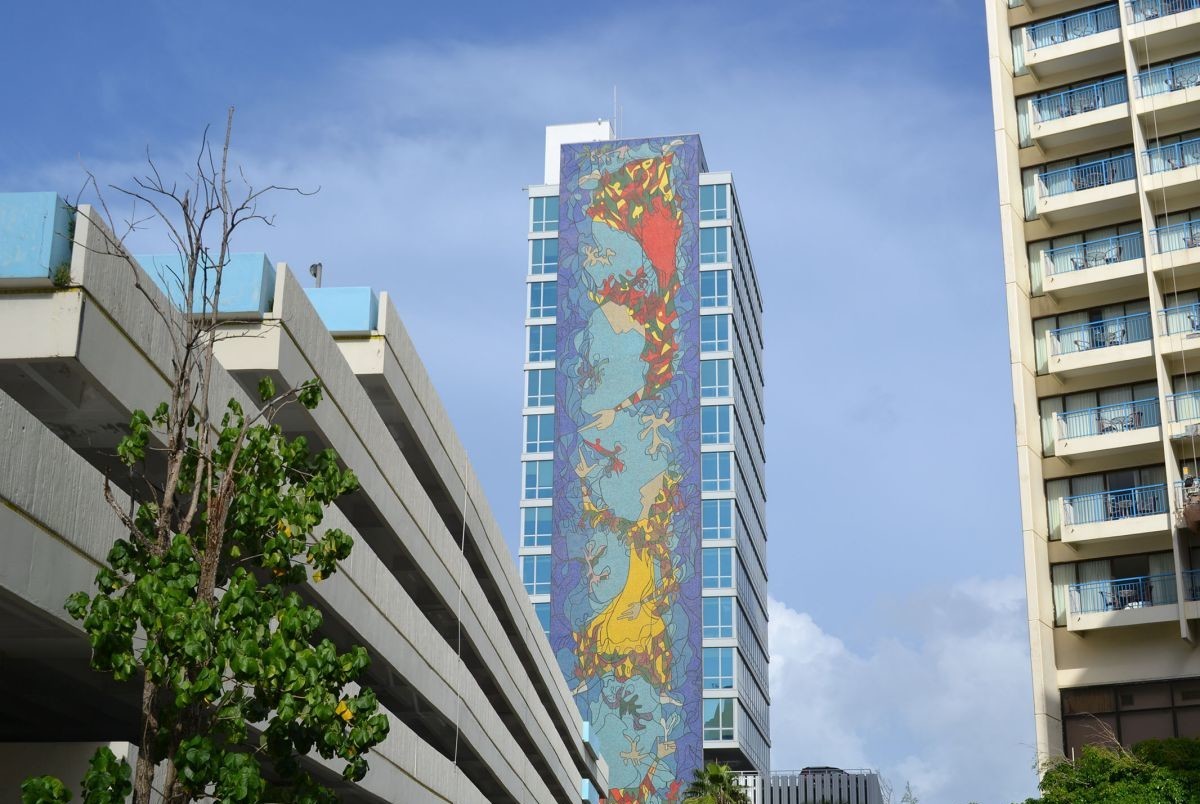
Come work at one of San Juan's most preferred locations. Conveniently located right across the street from the Caribe Hilton Hotel, one of the main destination for business travelers, you will find yourself amidst a business paradise.
Plan a business power lunch meeting in one of the many exquisite restaurants nearby. Get quick access to San Juan's nearby shopping malls, airport, drug stores, and night life; or simply let the stunning ocean view take you places while you work.
53 Cll Las Palmeras
San Juan, 00901
Puerto Rico
Join the premier business community in San Juan. Let's create your success story together.